
Thinking about a paywall? Read this first
Submitted by yelvington on December 1, 2009 - 10:39amIf you're thinking about charging for content, this high-quality infographic could save you from making a big mistake:
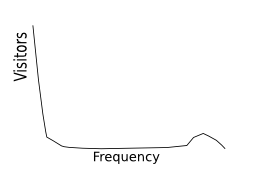
What is this? It's the general shape of your typical newspaper website's user behavior over the course of a month.
This is a not a graph that your typical Web metrics system offers up without a struggle, but if you can force it to reveal this data, it's eye-opening. I first pulled this sort of curve out of a Tacoda system half a dozen years ago, and it changed a lot of my thinking.