
If you're thinking about charging for content, this high-quality infographic could save you from making a big mistake:
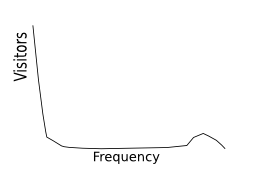
What is this? It's the general shape of your typical newspaper website's user behavior over the course of a month.
This is a not a graph that your typical Web metrics system offers up without a struggle, but if you can force it to reveal this data, it's eye-opening. I first pulled this sort of curve out of a Tacoda system half a dozen years ago, and it changed a lot of my thinking.
On the left side, you have awesome reach, both in-market and (as previously discussed) out-of-market. As you get better with SEO techniques, that spike gets even higher.
Most of those visitors come once or twice, probably following a link from a search engine or another website. They're looking for something very specific. They find it (or not) and leave.
Then the number drops like a rock. Hardly anybody comes five times in a month.
But over on the right side you have an interesting little lump.
It's small, but that's deceptive. That lump accounts for a big chunk of your website's traffic, because the people in that lump visit several times a week, maybe every day, maybe two or three times in a single day. When the visit, they consume maybe eight, maybe a dozen pages.
These are your loyalists. Compared with the overall population of visitors, they're far more likely to live in your market. They're keenly interested in your content, highly engaged in local life, and solid gold prospects for your advertisers.
Now here's what's wrong with a paywall. If you're trying to persuade people to give you money for your content, it's the wrong tool. It's like cutting butter with an ax handle. You're just going to make a big mess.
These guys over on the left side of the graph are not going to pay. The best you can hope for is a percentage of the people in the lump on the right. And in terms of a nose count, that's not a big number. So rein in your dreams of paid-content riches.
But wait, it gets worse. Those people over on the left side? Some of them are out-of-market lookie-lous, but some of them aren't. Your future is somewhere in that spike, and your paywall just told those people to eff off and go away. Your goal should be to persuade them to become regular users, not beat your chest and make demands.
Now, here's something that people from the online side of the fence can learn: A lot of people who have been thinking about paid content are discovering this curve. And those who do are coming to favor a completely different paid-content model, one that would leave the left side of the graph unmolested, and concentrate on persuading the people on the right side of the graph to pitch in some cash.
Several years ago when newspaper websites were all setting up registration systems, most of them did it completely the wrong way: you had to register to read anything. The one system that did it the right way was McClatchy's, which had a (configurable) threshold. You could read up to N pages per month. After hitting the limit, you'd be challenged and asked to create an account.
Random visitors were unmolested. Loyal visitors were asked to provide demographic data. Most did so, and those of us who actually dug through that data know that it was remarkably honest and accurate.
Journalism Online, the startup that's trying to persuade newspaper publishers to charge for content, is currently pushing a paid-content version of that model.
What should be the threshold? How price-sensitive is that group on the right side? Can you get significant reader revenue from that group without damaging your advertising business? Nobody knows, really, and surveys aren't likely to tell you.
It may not work at all. But it has going for it this one really important characteristic: It's looking for opportunity. In a discussion that has been dominated by ridiculous, absolutist declarations, that's a welcome change.
It will take some experimentation. Given the risk, I'm eager to see somebody else do it. Change is good; you first.
Comments
Reversing the Funnel
paywall or paid content
Quick calrification...
REAL paywall stats
It's not speculation
Joe: The chart is obviously a work of art (ahem) but it reflects real-world data from our newspapers. As for the frequency issue -- your frequency numbers should be high on a paid site. You're locking out the casual users. A simple paywall kills reach and growth, but among those who want your content badly enough to pay, the usage frequency should be high.
Pernell: Commercial broadcasting has been a money factory since the 1920s. We shouldn't approach this issue with predetermined articles of faith, but rather open questions about what works.
Michael: Local newspapers. We have over 1,400 local dailies in the United States, versus three national newspapers. I actually don't regard WSJ/NYT/USA Today as being in the same business as the rest of us.
I like this
Isn't this basically the same as the freemium model?
Follow-up
Nationals
I don't have any data on the national sites. Their usage curve might look the same, or it might not. If it does follow the same pattern, it might be helpful in analyzing their opportunities -- but there are many differences from local media. One is radically higher competition. Another is that the loyal and incidental users of a site like USA Today would seem to be fairly interchangeable in terms of economic value per page viewed, which is not true in the local space.
Still not sold...
Paywalls
Never say never
Viva la Visits per Visitor!
"the curve looks nothing like the graphic in your post"? Sure!
Good post
Interpretation of Visitor Loyalty